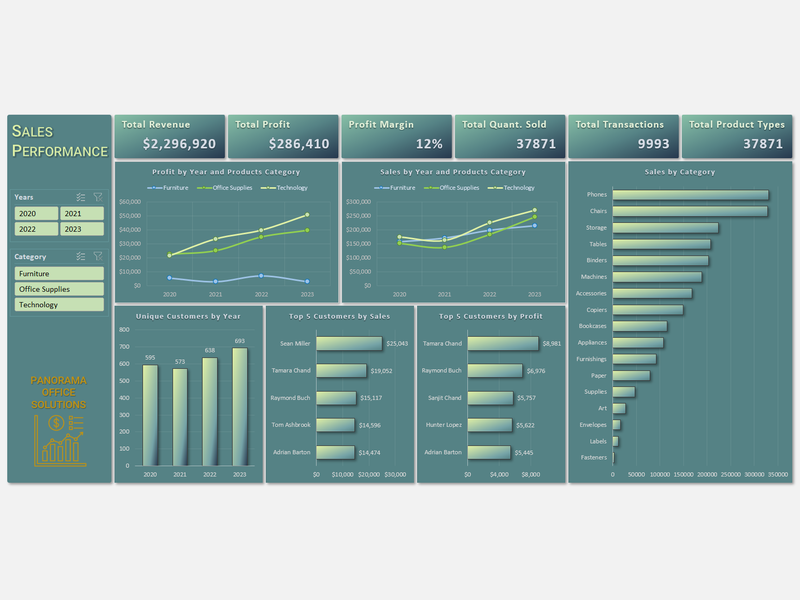
Excel Sales Dashboard Project
Project information
- Category: Data Analysis Demo Project
-
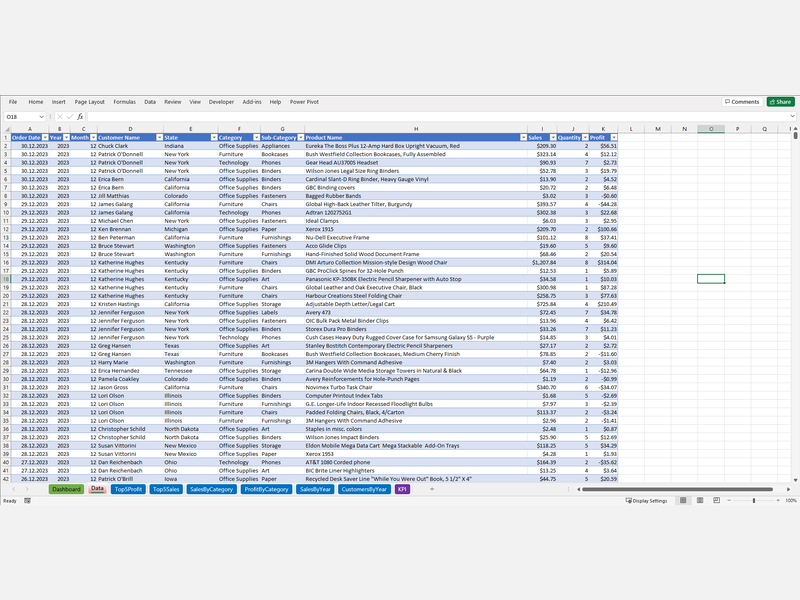
Data analysis and interactive dashboard in Excel using a sales dataset. Organized and cleaned the data, calculated key performance indicators (KPIs) such as total sales, profit margins, etc. The dashboard, enhanced with user-friendly color palettes, showcased insightful visualizations including dynamic charts and graphs.
- Technology used: Excel
- Project date: 2021
- Project URL: #